
1. Premise
Climate is a fundamental driver of environmental conditions and, as such, it is much influential on the health of humans. An illustrative introduction on the impact of climate change on human health is provided in the videos of the Centers for Disease Control and Prevention (CDC) Climate change and your health and How climate affects community health.
Why climate change affects human health? Through evolution, climate and physical condition of individuals co-evolve so that the latter adapts to the former. Changes in climate, of whatever nature, imply a corresponding adaptation of individuals. Such adaptation may require some time and imply adverse consequences. After global warming several concerns were raised on the impact on the health of people. These are the subject of intensive research activities.
It is important to remember that the different health impacts caused by climate change may not occur in isolation. People may face multiple impacts of different nature at the same time, at different stages in their lives, or accumulating over the course of their lives. For example, extremely hot days can lead to heat-related illness as well as poor air quality, by increasing the chemical reactions that produce smog. In addition, many of the factors that influence whether a person is exposed to health threats or whether they become ill, such as an individual’s personal habits, living conditions, and access to medical care, can also change over time.
1.1. Classification and study of climate impacts on human health
Medical issues caused by natural disasters, such as floods and hurricanes, can be classified into:
- issues associated with physical trauma;
- issues associated to non-traumatic conditions.
Physical traumas are only a fraction of the health impact of climate change. Actually, severe impacts are associated to non-traumatic conditions such as:
- cardiovascular diseases;
- respiratory diseases;
- vector-borne diseases;
- Mental disorder.
The above medical issues can also be divided into:
- short term impacts, like for instance physical traumas;
- long term impacts, like for instance mental disorder, who may also affect future generations.
Climate change impact of human health thus refer to several different medical specializations. Its mitigation requires a multidisciplinary (better interdisciplinary or transdisciplinary) approach, by seeking a connection with completely different disciplines like climate science, hydrology, economics and many others. Such need for crossing the boundaries between disciplines is one of the barriers to a comprehensive approach to the problem.
In fact, the effects of climate change on health are the product of complex mechanisms that attack several organs and systems in the human body. For example, climate change may be responsible for vector-borne diseases due to more favorable conditions for the survival of the pathogen or vector, or the increasingly reported psychosocial problems associated with the emotional burden induced by climate anxiety.
1.2. Climate effects on human health
Climate change may impact human health in several different ways depending on factors which may include:
- local climate variations;
- the climate variables which are affected by change;
- local conditions of the socio-economic context, like accessibility to health care, water security state, agricultural production and techniques;
- local features of populations, like age, nutrition, health state;
- climate change adaptation policies.
The health of people is affected through a change in one or more climatic variables, like:
- temperature,
- extreme rainfall,
- peak river flow,
- extreme wind velocity,
- solar irradiance and others.
Several sources indicate that the climate variables most relevant to health are:
- Temperature, generating heat waves and droughts;
- Extreme precipitation, generating floods and droughts;
- Extreme wind velocity generating windstorms.
In fact, climate change may affect food production and quality, air quality, water quality and the ecosystems conditions in general. Diseases caused by climate change include cardiovascular illnesses during events of extreme heat; chronic kidney disease among outdoor workers in hot areas; and many others.
A nice summary of the most significant exposure pathways by which climate change is affecting global health is given by chapter 11 of the 5th Assessment Report of IPCC, which is copied below in Figure 1.
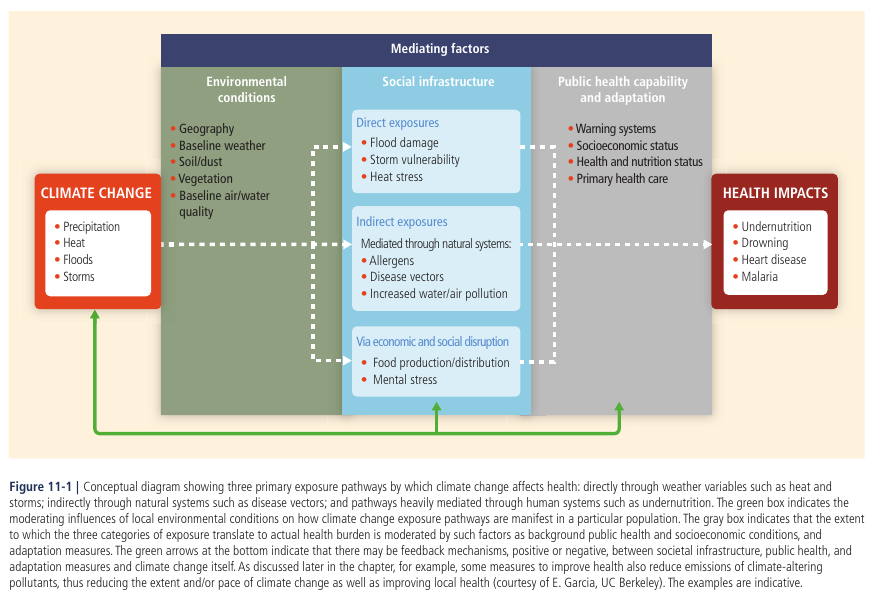
Figure 1. Exposure pathways by which climate change affect health. From IPPC 5th Assessment report.
A more detailed summary is given by Figure 2.
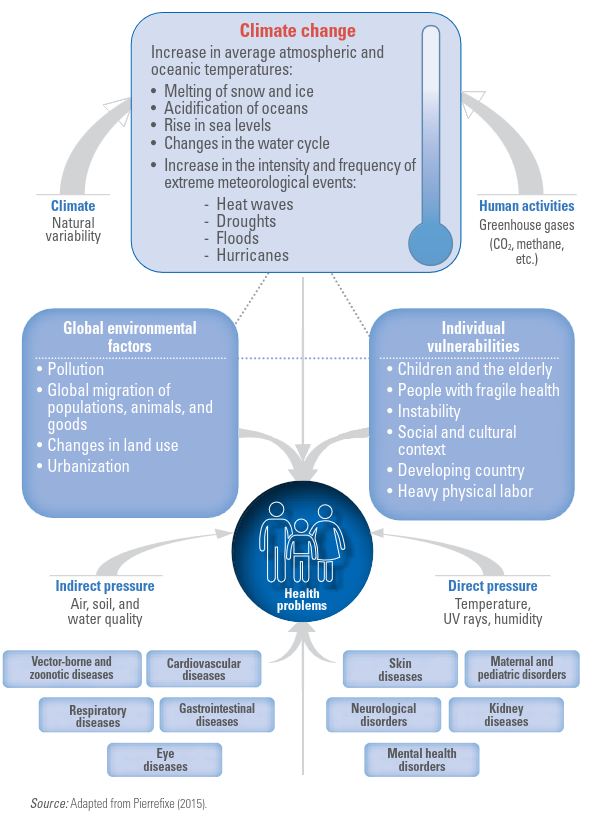
Figure 2. Climate change and its impact on Health. Modified from: Climate change for health professionals, PAHO and WHO, 2020, available at https://iris.paho.org/bitstream/handle/10665.2/52930/9789275122839_eng.pdf.
The effects of climate change on health are mostly given by the interplay of complex mechanisms that may impact - in principle - several organs and systems in the human body. For instance, gastroenteritis due to water pollution caused by the overflow of sewer system due to heavy rains or floods, an increase in vector-borne diseases due to more favorable conditions - perhaps given by higher temperature - for the survival of the pathogen or vector, cardiovascular diseases in response to thermal stress from heat waves, or the psychosomatic problems associated with the emotional stress due to change.
To provide an example of climate impact, Figure 3 shows the annual incidence of Lyme disease in the United States from 1991 to 2018, which is calculated as the number of new cases per 100,000 people. It is clear that there is an increasing trend which is probably due to increasing temperature implying a longer seasonal life cycle of ticks, although other drivers may act as concurrent factors, like for instance the increasing density of host wildlife.
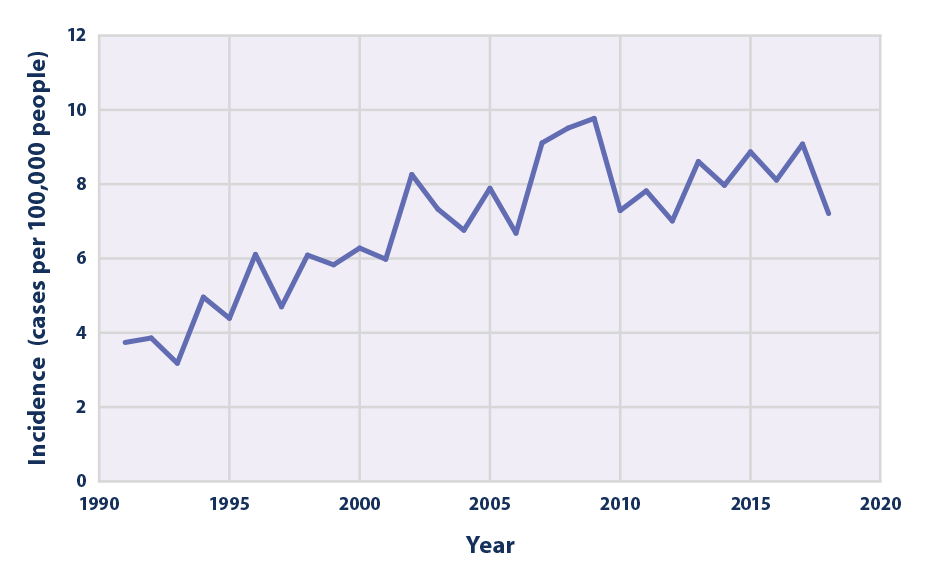
Figure 3. Annual incidence of Lyme disease in the United States from 1991 to 2018. Source: US Environmental protection agency (EPA)
The incidence of Lyme disease is an example of an indicator of climate change impact on human health.
2. State of global health
The state of the global health is analysed by several disciplines and is the subject of a its own discipline. We refer here to the state of global health in connection with changes in climate. A brief analysis presented by Fourth Assessment Report of IPCC (AR4), published in 2007, which recognizes a significant improvement in life expectancy in most of the world in the 20th century. Life expectancy at birth reflects the overall mortality level of a population. It summarizes the mortality pattern that prevails across all age groups in a given year – children and adolescents, adults and the elderly. Global life expectancy at birth in 2015 was 71.4 years (73.8 years for females and 69.1 years for males).
Figure 4 shows the progress and projection of life expectancy by United Nations. From 2000 to about 2015 there has been a consistent increase. In fact, global average life expectancy increased by 5 years between 2000 and 2015, the fastest increase since the 1960s. The increasing trend continued throughout the first decade of the 21st century (Wang et al., 2012). In some countries (i.e. China) there has been a more significant improvement which has contributed significantly to the increase of global averages, but most countries have benefited from substantial reductions in mortality. Considerable inequalities in life expectancy are still detected within and between nations, which may be due to differences in education, income and other factors (Beaglehole and Bonita, 2008). In some countries, official statistics are not coherent in terms of quality and coverage thus making difficult to draw firm conclusions about health trends (Byass, 2010).
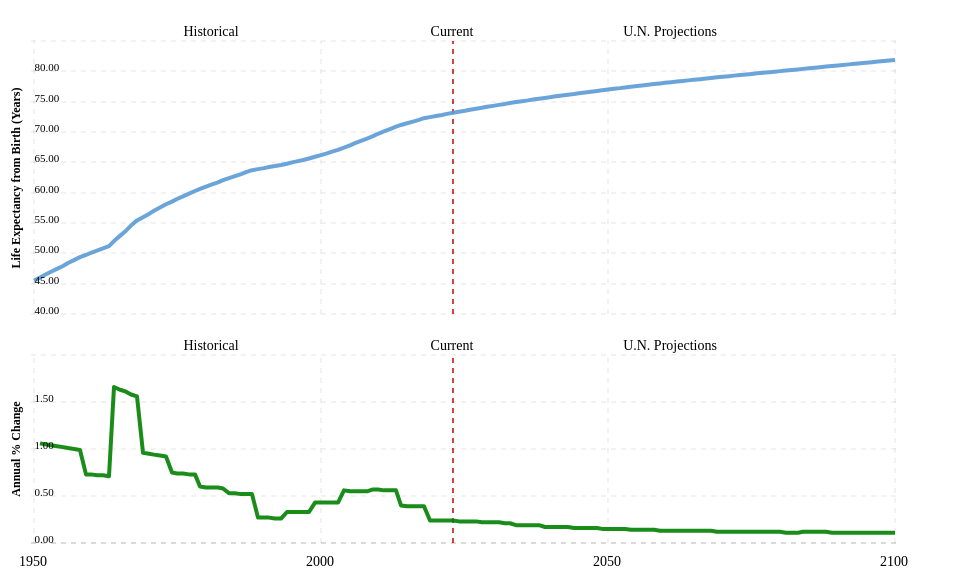
Figure 4. Progress and projection of life expectancy by United Nations. Source: https://www.macrotrends.net/countries/WLD/world/life-expectancy.
Figure 5 shows the progress of life expectancy for Italy.
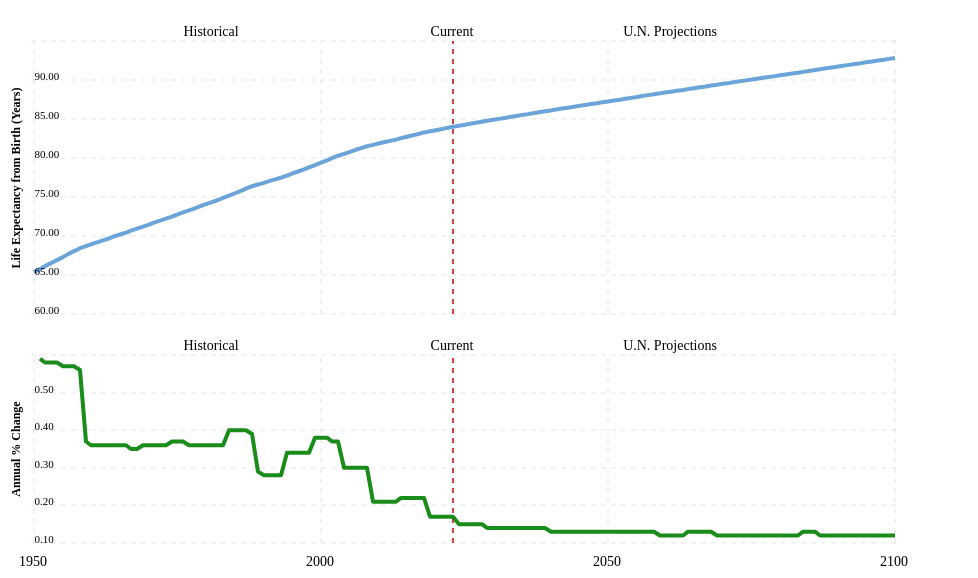
Figure 5. Progress and projection of life expectancy by United Nations for Italy. Source: https://www.macrotrends.net/countries/ITA/italy/life-expectancy.
If economic development continues with the current trend, it is expected that mortality will continue to decline in most countries; the World Health Organization (WHO) predicts that the global burden of disease (measured in disability-adjusted life years per capita) will decrease by 30 percent by 2030, compared to 2004 (WHO, 2008). The underlying causes of global poor health status are expected to change significantly, with much more preponderance of chronic diseases and injuries; however, the greater infectious diseases of adults and children will remain important in some regions, particularly sub-Saharan Africa and South Asia (Hughes et al., 2011).
The Fifth assessment report of IPCC affirms with very high confidence that human health is affected by climate change (Smith et al., 2014). Impacts included the expansion of the geographical ranges of some diseases and changes in the distributions of some food-, water- and vector-borne diseases - VBD (high confidence). Increasing future health risks were projected from injury, disease and death due to intense heatwaves and fires (very high confidence), undernutrition, food- and waterborne diseases (very high confidence) and VBDs (medium confidence). The Fifth assessment report (AR5) found that climate change is a multiplier of existing health vulnerabilities, including food insecurity and limited access to safe water, improved sanitation, healthcare and education. A relevant question is the assessment of baseline vulnerabilities that would persist after climate change is ipotetically mitigated.
Since the publication of AR5, and particularly in the recently published Sixth assessment report, there has been a relevant focus of the impact of climate change on migration fluxes and political tensions. The latter also have an impact on inflation, which in turn reflects on the public debt of countries and - in turn - on the availability of resources for climate change mitigation and adaptation. These impacts will be discussed in a separate lecture.
Box: specification of uncertainty
In the IPCC terminology uncertianty is quantified through a level of confidence, that is expressed using five qualifiers:
- very low,
- low,
- medium,
- high,
- very high.
It synthesizes the author teams’ judgments about the validity of findings as determined through evaluation of evidence and agreement (Mastrandrea et al., 2010). There is flexibility in this relationship; for a given evidence and agreement statement, different confidence levels could be assigned, but increasing levels of evidence and degrees of agreement are correlated with increasing confidence see Figure B1.
Confidence should not be interpreted probabilistically, and it is distinct from “statistical confidence.” In other disciplines, like for instance engineering, uncertainty is measured quantitatively through probabilities.
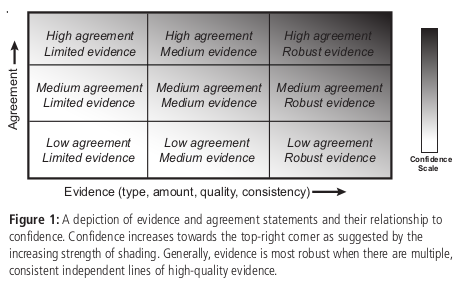
Figure B1. Uncertainty specification by IPCC. From Mastrandrea et al. (2010).
3. Assessing the impact of climate change on human health
Hitherto we have discussed the implications of climate change on health essentially through a narrative, by adopting a qualitative approach. This is useful to understand the links and feedbacks between related mechanisms.
Figure 6 (by the US Environmental Protection Agency (EPA)) shows the links between climate impacts and exposure, environmental and institutional context, social and behavioral context (note that the term "exposure" is used by EPA with a different meaning with respect to the following parts of this lecture).
To quantify in quantitative terms the connections between climate and health we need to describe the above mechanisms with a model. For this reason, the assessment of the impact of climate change in terms of global human health is a a scientific challenge. It is well known that climate is a reason of mortality from ancient times. Climate is naturally affected by variability and change. Variability causes the occurrence of extremes, and related environmental shocks. Change causes permanent shift in the ecosystem dynamics and conditions. However, to quantify this effects in quantitative terms entails uncertainty, which should be quantified as well. A usual procedure for quantifying the impact of climate change is risk analysis which is also applied to study the impact on health. Risk analysis implies the estimation of hazard, vulnerability and exposure.
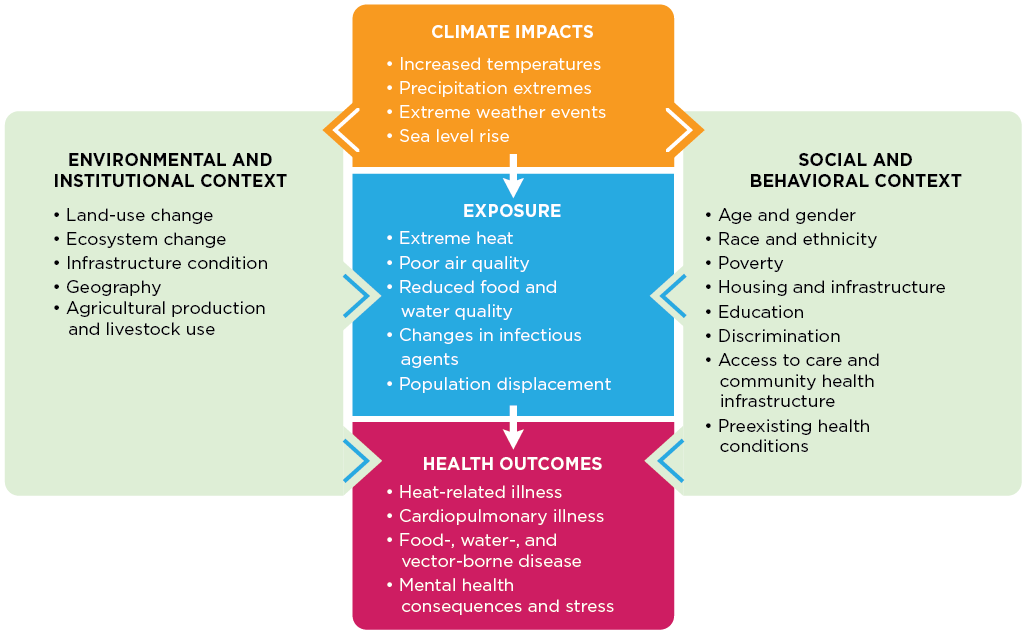
Figure 6. Climate change impact on human health according to the US Environmental Protection Agency (EPA).
By following the WHO Guidance on Research Methods for Health Emergency and Disaster Risk Management (2020), risk, hazard, exposure and vulnerability can be defined as follows.
- The risk R induced by a considered event is given by the combination of hazard P, exposure E and vulnerability V. R is a measure of the expected damage during an assigned time period given by a considered event, depending on the vulnerability of the considered system and the potential damage if the event actually occurs, which is in turn related to the nature and quantity of the exposed goods.
- Hazard is the probability that a given adverse event occurs in a given time period. The adverse events can be natural (earthquake, landslide, tsunami, cyclones, extreme temperatures, floods, or droughts), biological (disease outbreaks including human, animal, and plant epidemics and pandemics), technological (chemical and radiological agent release, explosions, and transport and infrastructure failures), societal (conflict, stampedes, acts of terrorism, migration, and humanitarian emergencies).
- Vulnerability is the probability that the system gets damaged if the adverse event occurs. Vulnerability depends on the presence of measures to prevent adverse effects of climate change, like levees for floods, vaccination campaigns for diseases etc.
- Exposure is the value (not necessarily expressed in monetary terms) of the assets at risk, like people, industries, agricultural systems etc.
In the risk based approach hazard, vulnerability and exposure are multiplied and integrated over the range of possible events and their intensity to estimate risk. Thus, under the above premises, risk \(R\) associated to a specific event can be estimated through the relationship
$$R = P V E. (1)$$
According to (1), risk is then expressed numerically and in the same unit as E. On the one hand this solution is qualitative and practical; on the other hand, it may be difficult to associate a value to intangible assets. Furthermore, it may be inappropriate to estimate the physical risk for human beings as for a quantifiable damage. Therefore, some authors suggest that the physical risk for humans is estimated separately, by using proper procedures for evaluating probability, vulnerability and exposure. In what follows we refer for simplicity to a situation where physical damage for humans is excluded.
Box: Probability
Probability describes the likelihood of an event. Probability is quantified as a number between 0 and 1 (where 0 indicates impossibility and 1 indicates certainty). The higher the probability of an event, the higher the likelihood that the event will occur. Probability may be defined through the Kolmogorov axioms:
- Axiom 1: The probability of an event is a real number greater than or equal to 0.
- Axiom 2: The probability that at least one of all the possible outcomes of a process (such as rolling a die) will occur is 1.
- Axiom 3: If two events A and B are mutually exclusive, then the probability of either A or B occurring is the probability of A occurring plus the probability of B occurring.
Probability may be estimated through an objective analysis of experiments, or through belief. This subdivision originates two definitions of probability. The frequentist definition is a standard interpretation of probability; it defines an event's probability as the limit of its relative frequency in a large number of trials. Such definition automatically satisfies Kolmogorov's axioms. The Bayesian definition associates probability to a quantity that represents a state of knowledge, or a state of belief. Such definition may also satisfy Kolmogorov's axioms, although it is not a necessary condition. Frequentist and Bayesian probabilities should not be seen as competing alternatives. In fact, the frequentist approach is useful when repeated experiment can be performed (like tossing a coin), while the Bayesian method is particularly advantageous when only a limited number of experiments, or no experiments at all, can be carried out. The Bayesian approach is particularly useful when a prior information is available, for instance by means of physical knowledge.
Probability distribution A probability distribution (or probability function) assigns a probability to a considered random event. To define a probability distribution, one needs to distinguish between discrete and continuous random variables. In the discrete case, one can easily assign a probability to each possible value, by means of intuition or by experiments. For example, when rolling a fair die, one easily gets that each of the six values 1 to 6 has equal probability that is equal to 1/6. One may get the same results by performing repeated experiments.
In the case a random variable takes real values, like for instance wave height, probabilities can be nonzero only if they refer to intervals. To compute the probability that the outcome from a real random variable falls in a given interval, one needs to define the probability density. Let us suppose that a interval with length 2Δx is centered around a generic outcome x of the random variable X, from the extremes x-Δx and x+Δx. Now, let us suppose that repeated experiments are performed by extracting random outcomes from X. The frequency of those outcomes falling into the above interval can be computed as:
Fr(x-Δx;x+Δx) = N(x)/N,
where N(x) is the number of outcomes falling into the interval and N is the total number of experiments. We can define the probability density of x, f(x), as:
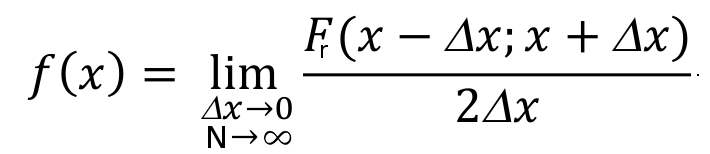
If an analytical function exists for f(x), this is the probability density function, which is also called probability distribution function, and is indicated with the symbol "pdf". If the probability density is integrated over the domain of X, from its lower extreme up to the considered value x, one obtains the probability that the random value is not higher than x, namely, the probability of not exceedance. The integral of the probability density can be computed for each value of X and is indicated as "cumulative probability". By integrating f(x), if the integral exists, one obtains the cumulative probability distribution F(X), which is often indicated with the symbol "CDF".

Figure B1.1. The probability function p(S) specifies the probability distribution for the sum S of counts from two dice. For example, the figure shows that p(11) = 1/18. p(S) allows the computation of probabilities of events such as P(S > 9) = 1/12 + 1/18 + 1/36 = 1/6, and all other probabilities in the distribution.
Example: the Gaussian or normal distribution The Gaussian or Normal distribution, although not much used for the direct modeling of hydrological variables, is a very interesting example of probability distribution. I am quoting from Wikipedia:
In probability theory, the normal (or Gaussian) distribution is a very common continuous probability distribution. Normal distributions are important in statistics and are often used in the natural and social sciences to represent real-valued random variables whose distributions are not known [...]
The normal distribution is useful because of the central limit theorem. In its most general form, under some conditions (which include finite variance), it states that averages of random variables independently drawn from independent distributions converge in distribution to the normal, that is, become normally distributed when the number of random variables is sufficiently large. Physical quantities that are expected to be the sum of many independent processes (such as measurement errors) often have distributions that are nearly normal. Moreover, many results and methods (such as propagation of uncertainty and least squares parameter fitting) can be derived analytically in explicit form when the relevant variables are normally distributed."
The probability density function of the Gaussian Distribution reads as (from Wikipedia):

where μ is the mean of the distribution and σ is its standard deviation.

Figure B1.2. Probability density function for the normal distribution (from Wikipedia)
While eq. (1) looks extremely simple, actually the estimation of \(P\), \(V\) and \(E\) is not straightforward. Essentially:
- Probability can be estimated through a climate analysis, by referring to given climate scenarios;
- Vulnerability estimation requires an analysis of the social context, in particular of prevention policies, state of the health care system etc.;
- Exposure estimation is based on an economic or social analysis of the monetary and/or physical damage that may occur to population if a hazard materialises with an adverse event and people are fully vulnerable (policies to reduce vulnerability fail).
Then, within the risk based approach the assessment of the impact of climate change on health can be articulated along the following steps:
- Assessment of hazard changes by considering the change in climatic variables;
- Assessment of other hazards related to climate change, like for instance the consequences of climate change mitigation and adaptation;
- Assessment of vulnerability and exposure through "health determinants" which translate change in climatic and other systems variables into health outcomes with respect to current baseline;
- Identification of "health benefits" which may derive from climate change;
- Critical synthesis of the results and identification of the additive impacts due to climate change.
A more detailed description of the risk based approach can be found here.
4. Hazard change due to climate change
The title of this section refers to the current usage of the term "climate change" with the meaning of "anthropogenic climate change". Actually, rigorously speaking we should define climate variability to mean variations in the climate that last longer than individual weather events, whereas the term climate change should only refer to those variations that persist for a longer period of time, typically three decades at least. However, in the current usage of media and some scientists the term "climate change" is meant to refer to human induced changes only.
Whatever definition we use, we should have clear that climate is naturally changing, in both short time windows (and in this case we use the term variability) and the long time window (think of the glaciations). In particular, time variability is the feature underlying the occurrence of extremes, that cause droughts, heavy rainfall, cyclones, and floods. These disasters are a natural feature of climate which have a long history. The occurrence of climate changes and extremes caused the decline of ancient civilisations. Increased climate variability from c. 250 to 600 coincided with the decline of the Western Roman Empire. Another interesting example is given by the long history of land reclamation in the Emilia-Romagna region, in Italy, which was severely affected by the occurrence of floods during the Little Ice Age.
In view of climate variability, it is a challenge to assess the change in climatic variables that is currently induced by anthropogenic global warming and climate change. In fact, while global warming is rigorously quantified, it is still problematic to quantify the changes in other relevant climatic variables which are more heterogeneous in space and more fluctuating in time than temperature. Let's point out once again that climate may affect people mainly through:
- Temperature (heat waves, fires, increasing demand for water, etc);
- Wind (extreme windstorms, increased evaporation etc);
- Long and short term rainfall (extreme storms, floods, droughts, etc);
- River flow and groundwater flow (floods, droughts, etc);
- Other hydrological variables like water storage, etc.
In a few words, one may say that climate affects human health mainly through temperature and the water cycle. With the difference that temperature is varying more regularly than water variables, that are typically non-Gaussian and therefore more subjected to the occurrence of extremes.
The feeling is that temperature and "water" extremes are increasing under global warming. This feeling is also supported by physical considerations like the Clausius-Clapeyron equation, that may indeed confirm that the hydrological cycle is accelerating. However, climate observation provide only partial support to the above feeling, in particular for those climatic variables that are difficult to observe. There has been a lot of studies on extreme rainfall which point out local increases (see, for instance, Papalexiou and Montanari (2019)), but changes in extreme rainfall appear irregular in space.
The challenge of estimating changes due to anthropogenic global warming is often resolved by using climate models, but we need to use particular care. In fact, climate models perform relatively well in the simulation of temperature, while they are still subjected to relevant uncertainty in the simulation of strongly heterogeneous variables that also affected by relevant time variability, like for instance those that are governed by convective processes.
Simulation from climate models are available in several public repositories like the Copernicus Climate Data Store. Simulations from many models are available which allow one to obtain an ensemble simulation. Projections can be obtained by using different emission scenarios, namely, different hypotheses on the future evolution of human impact on climate through CO2 emissions. Figure 7 - from Our World in Data - reports a skecth of the scenarios that are considered.
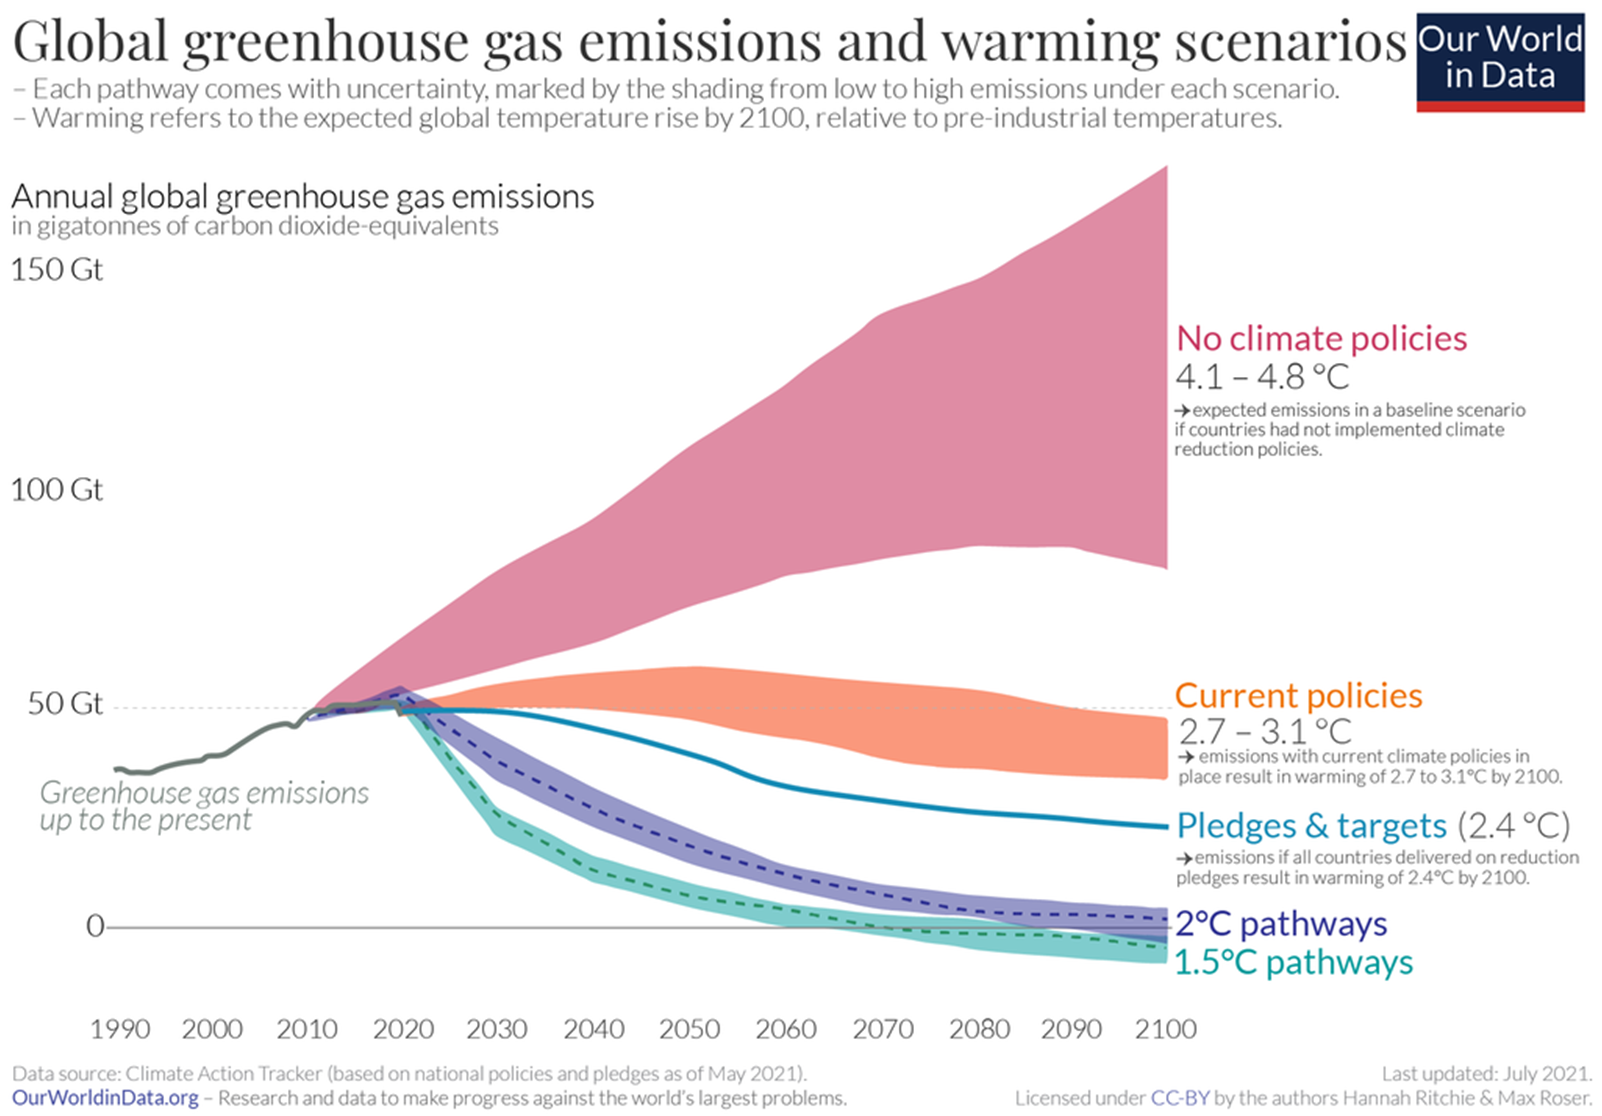
Figure 7. Emission scenarios corresponding from different policies. From Our World in Data, licensed CC-BY by authors Ritchie and Roser.
Climate projections are usually available at fine spatial and temporal resolution up to 2100, thus allowing to track the evolution of climate in time and obtaining a prediction of future variables which may be influential on the human health.
It is currently assumed that the above projections are conservative in terms of climate impact. Actually, in view of the above mentioned uncertainties, particular care must be taken when using climate projections for impact studies. In particular, Guo and Montanari (2023) recently demonstrated that historical data, through statistical frequency analysis of extremes, may depict a more conservative picture of future drought risk.
In summary, a well designed integration of climate models projections and historical data analysis, depending on local context and data availability, is currently suggested for drawing scenarios of future climate.
5. Assessment of hazard, vulnerability and exposure due to climate change mitigation and adaptation
In order to make communities less exposed - and resilient - to climate change, mitigation and adaptation measures are usually adopted. Climate change mitigation aim at reducing emissions of greenhouse gases or removing those gases from the atmosphere in order to mitigate the greenhouse effect (see Figure 8).
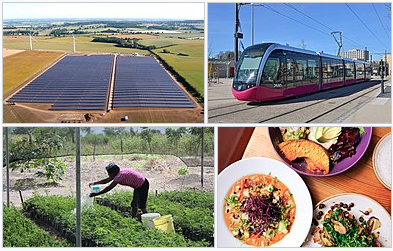
Figure 8. Action for climate change mitigation (from Wikipedia). Clockwise from top left: Renewable energy – solar and wind power –, electrified public transport, plant-based meals, and a reforestation project to remove carbon dioxide from the atmosphere.
Climate change adaptation is the process of adjusting to the effects of climate change, by reducing vulnerability and exposure to impacts.
Adaptation and mitigation measures can have intended and unintended health impacts (Romanello et al., 2021; Cheng et al., 2013), both positive and negative.
Mitigation measures often have co-benefits on health. For instance, reduction of vehicle emission standards may improve urban mass transport systems. Bicycle lanes can result in substantial health benefits through changes in physical activity, reduction of noise, traffic and air pollution. Replacing electricity production with fossil fuels with renewable energy technologies may lower the disease burden from air pollution. Similarly, diets based on replacing animal proteins with vegetable-based proteins may reduce the incidence of cancer.
However, some measures can also have unintended negative health consequences. For example, while an increase of the use of electric vehicles may reduce the emissions of greenhouse gases, the displacement of batteries and the need to increase electricity production may generate a negative feedback on emissions and air pollution. Adaptation measures may also affect human health positively and negatively. Reducing the exposure and vulnerability to floods may reduce the number of affected people. The use of air conditioning may reduce the risk associated to heat waves. On the other hand, air conditioning may increase air pollution and the vulnerability to respiratory diseases.
Luyten et al. (2023) recently published an interesting review (open access) of health impact studies of climate change, which we refer to in the following paragraphs. The considered the outcome from 56 and 33 studies focusing on mitigation and adaptation measures, respectively. The mitigation articles considered a total of 181 and 43 mitigation and adaptation measures, respectively. Figure 9 reports the main health outcomes categories and the non-communicable diseases (NCD) specific health outcomes reported by the articles they reviewed, disaggregated for adaptation-related and mitigation related-articles.
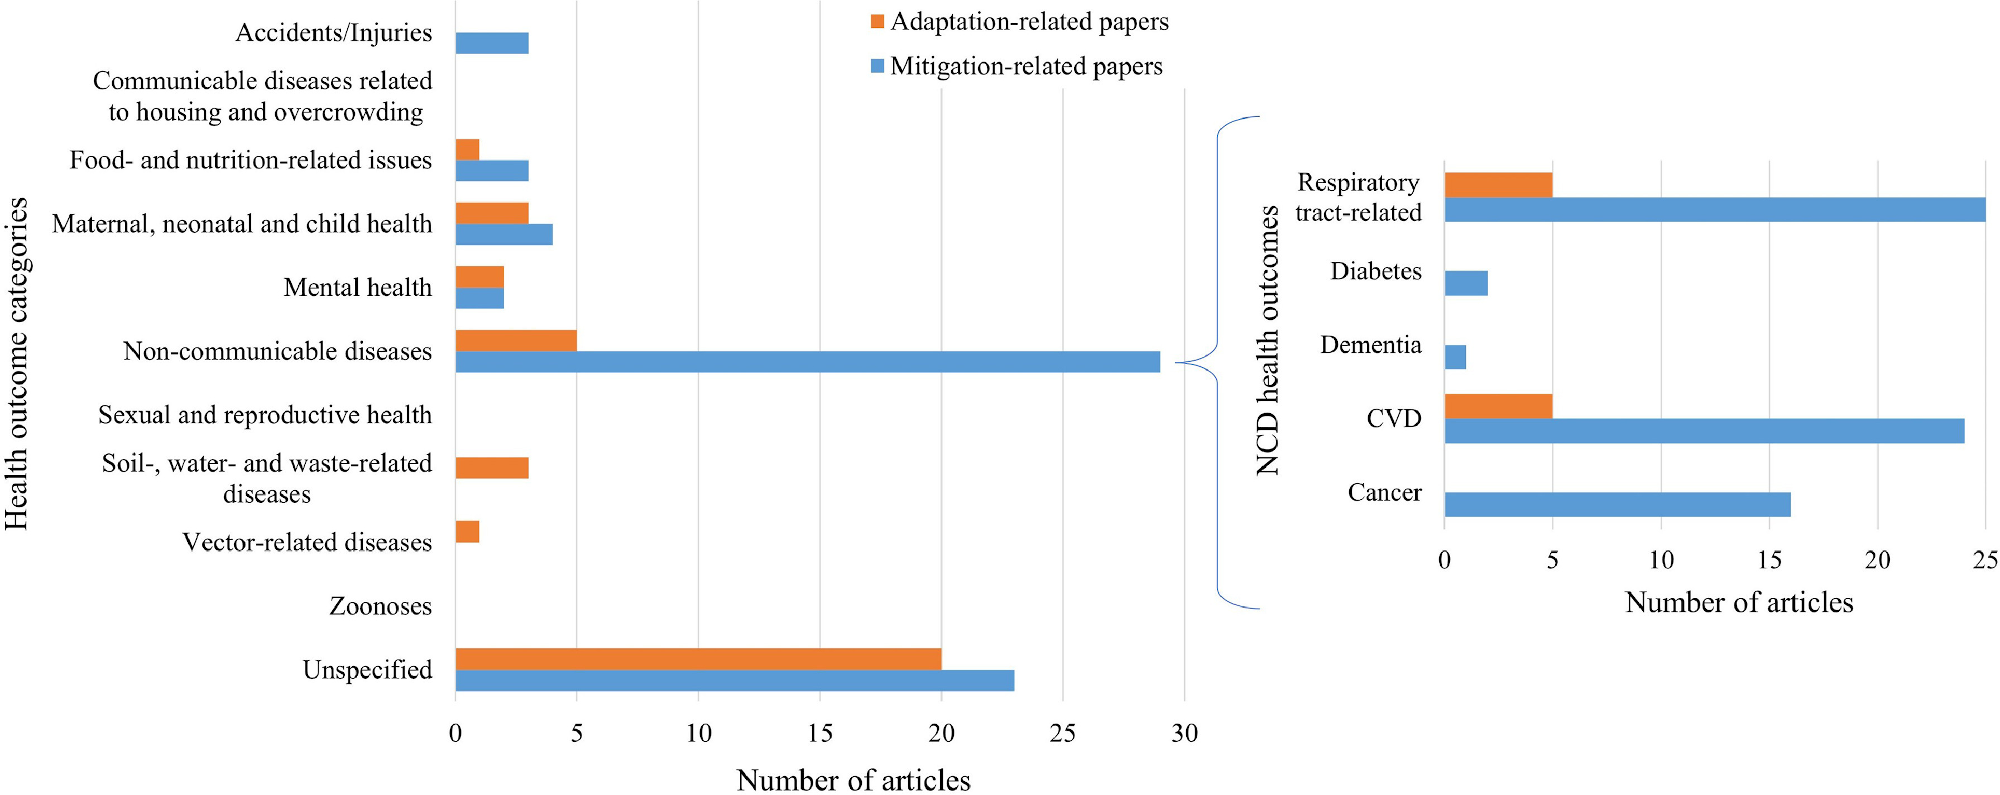
Figure 9. Main health outcome categories and NCD specific health outcomes reported by articles, disaggregated for adaptation-related and mitigation related-articles. Note that one paper can report multiple health outcomes. NCD = non-communicable disease. CVD = cardio-vascular disease. From Luyten et al. (2023).
Luyten et al. (2023) found that:
Regarding health impacts, 65 (73%) articles found only positive and 5 (6%) articles only negative health impacts, while 14 (16%) articles found both positive and negative health impacts of the investigated climate change measures [...]. Health impacts were categorized based on the nature of the health outcome, meaning that for example a decrease in deaths is considered positive health impact while an increase in disease cases is considered a negative impact. In the remaining 5 (6%) articles, there was uncertainty concerning the direction and magnitude of health impacts associated with the investigated climate measures.
Regarding the nature of the reported health impacts, around half (n = 44, 49%) of articles reported only mortality-related quantified health impacts, e.g. avoided or excess premature deaths. Over a fifth of articles (n = 19, 21%) reported only morbidity related impacts, which were quantified using a plethora of indicators such as disability-adjusted life years, disease cases, number of hospitalizations, number of intensive care unit admissions and scores on standardized scales. The remaining 26 articles (30%) reported both mortality and morbidity quantified health impact estimates.
The impacts of human health were most frequently associated with air quality, followed by the individual health determinant associated to physical activity (Figure 10). A mitigation measures impacting air quality may be replacement of energy from coal by renewable energy sources or implementation of a carbon tax. A measure impacting physical activity levels is the shift from individual motorized vehicles to bicycles.
Health impacts from the investigated adaptation measures were most frequently associated with air temperature, followed by the institutional capacity of health care system. Adaptation measures impacting air temperature may be urban greening (Figure 11).
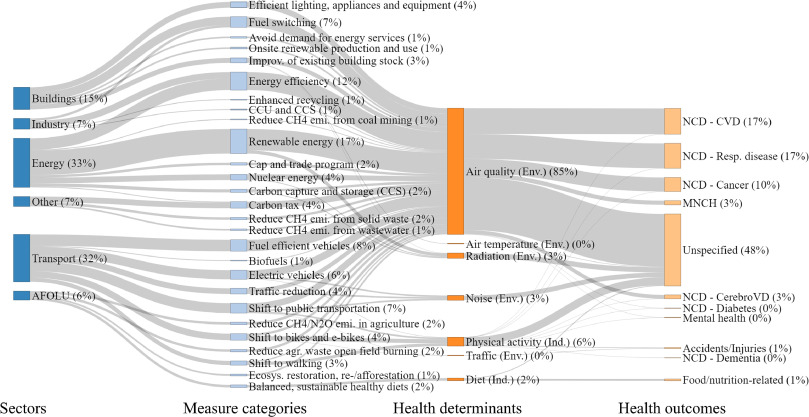
Figure 10 (from Luyten et al. (2023), CC-BY). Sankey diagram of mitigation measures and related health determinants and health outcomes. In the first two columns, the measures are categorized according to sector and measure types based on IPCC typology. In the last two columns, health determinants and outcomes are displayed. The percentages refer to the share of the total number of measures (note that due to rounding a percentage that is very close to zero may be displayed as zero). The width of the bars in the columns “Health determinants” and “Health outcomes” is weighted by the number of total health determinant/outcome categories considered for each measure. For example, if a study assessed impacts of a specific measure on two health outcomes, the width of each bar is divided by two. AFOLU = agriculture, forestry and other land use; agr. = agricultural; CCS = carbon capture and storage; CCU = carbon capture with utilization; CerebroVD = cerebrovascular disease; ecosys. = ecosystem; emi. = emissions; env. = environmental; improv. = improvement; ind. = individual; inst. = institutional; MNCH = maternal, neonatal and child health; NCD = non-communicable disease; resp. = respiratory; CVD = cardio-vascular disease.
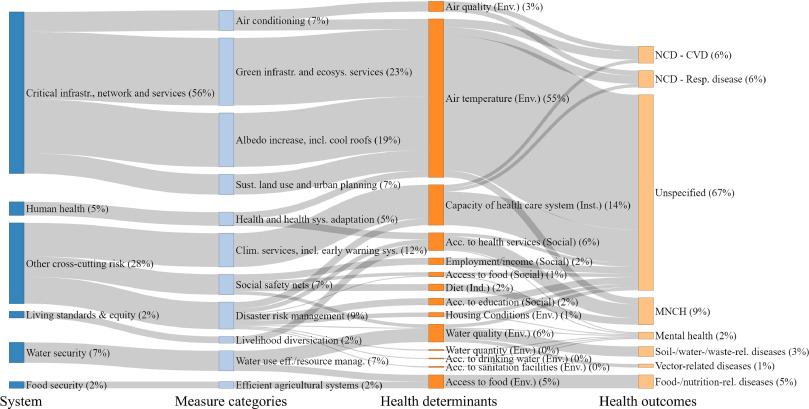
Figure 11 (from Luyten et al. (2023), CC-BY). Sankey diagram of adaptation measures and related health determinants and outcomes. In the first two columns, the measures are categorized according to system and measure types based on the adapted IPCC typology. In the last two columns, health determinants and outcomes are displayed. The percentages refer to the share of the total number of measures (note that due to rounding a percentage that is very close to zero may be displayed as zero). The width of the bars in the columns “Health determinants” and “Health outcomes” is weighted by the number of total health determinant/outcome categories considered for each measure. For example, if a study assessed impacts of a specific measure on two health outcomes, the width of each bar is divided by two. acc. = access; ecosys. = ecosystem; eff. = efficiency; env. = environmental; incl. = including; ind. = individual; infrastr. = infrastructure; inst. = institutional; manag. = management; MNCH = maternal, neonatal and child health; rel. = related; resp. = respiratory sys. = systems.
The authors conclude that:
....collectively, non-communicable diseases (NCDs) were by far reported most often in connection with the investigated mitigation measures, followed by maternal, neonatal and child health health outcomes. [....] NCDs also were most frequently reported in connection with adaptation measures, followed by maternal, neonatal and child health outcomes. Other health outcomes were rarely found by both adaptation- and mitigation-related articles. Among the NCDs, respiratory tract-related health outcomes and cardiovascular diseases were found most frequently [...]. Around a sixth of articles (n = 15, 17%) reported at least one quantified health outcome in a stratified way, i.e. providing a health outcome for at least two distinct sub-populations. Health outcomes were most frequently stratified according to age (n = 13, 15%). A small minority of articles (n = 5, 6%) provided quantified health outcomes stratified according to a different variable, e.g. socio-economic status (n = 3), education (n = 2), marital status (n = 2), occupation (n = 2), sex (n = 2), or health (n = 1, i.e. presence/absence of disease).
Luyten et al. (2023) point out that other health outcomes besides NCDs, such as mental health, food- and nutrition-related issues and communicable diseases, are underrepresented, probably for reasons related to the type of measures that were considered. Actually, risk for mental health is know to be potentially related to climate change mitigation and adaptation. Furthermore, they point out that climate change is expected to affect the spread of communicable diseases, which are rarely reported in the reviewed contributions, which were prepared before the COVID-19 pandemic. They also point out the their review is mainly focusing on high income countries and does not consider social-health determinant which may affect the vulnerability of people to climate change.
6. Hazard, vulnerability and exposure estimation through "health determinants"
In the previous section mention was made to health determinants. They are features of biological, socio-cultural, economic, behavioural and institutional systems which may affect human health. The term ‘determinants of health’ refers to those factors that have a significant influence, whether positive or negative, on health. These factors depend on climatic variables and are also related to vulnerability and exposure.
Identification of relevant health determinants is essential to decipher the impact of climate change on human health. In fact, health determinants may be obtained through climatic and socio-economic projections thus allowing a prediction of the future state of global health.
Health determinants may refer - and be useful support - to the estimation of hazard, exposure and vulnerability, depending on the nature of the indicator. If the indicator is a climatic variable it may specifically refer to hazard, but if combined with social variables or features may also refer to vulnerability and exposure. For instance, the indicator "drought frequency" specifically refers to drought hazard estimation, but if combined with the state of water supply systems may also provide an indication of vulnerability.
An interesting contribution to the identification of health determinants is given by the initiative “Lancet Countdown: Tracking Progress on Health and Climate Change”. Since 2015 the Lancet Countdown has been providing a global monitoring system that tracks the complex, reflective ways in which climate change affects health. The Lancet countdown considers a set of climate change and health indicators spanning five domains of the climate-health system:
- Health hazards, exposures, and impacts;
- Adaptation, planning, and resilience for health;
- Mitigation actions and health co-benefits;
- Economics and finance;
- Public and political engagement.
These indicators are identified with the term "Climate change and health indicators (CCHIs)" in the open access contribution by Di Napoli et al. (2022). They may be predicted by socio-economic models depending on features of the future climate.
To give an example, Figure 12 presents a map of the health determinant "Physical activity hours lost" when heat exceeds a preassigned threshold. The threshold is set as 33°C, above which experts in China, the USA, and Australia advise against outdoor physical activities because of the high risk of heat illness, and above which deaths from hyperthermia are likely to increase (Cai et al., 2022).
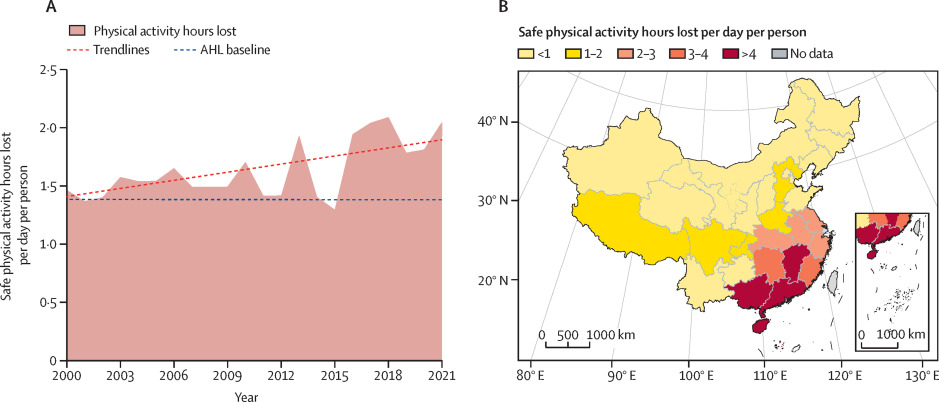
Figure 12. Average hours of safe physical activity lost per person per day due to high heat index. From Cai et al. (2022).
Figure 13 shows the health risks associated with climate change in each province in China in 2021 compared with historical baseline averages.
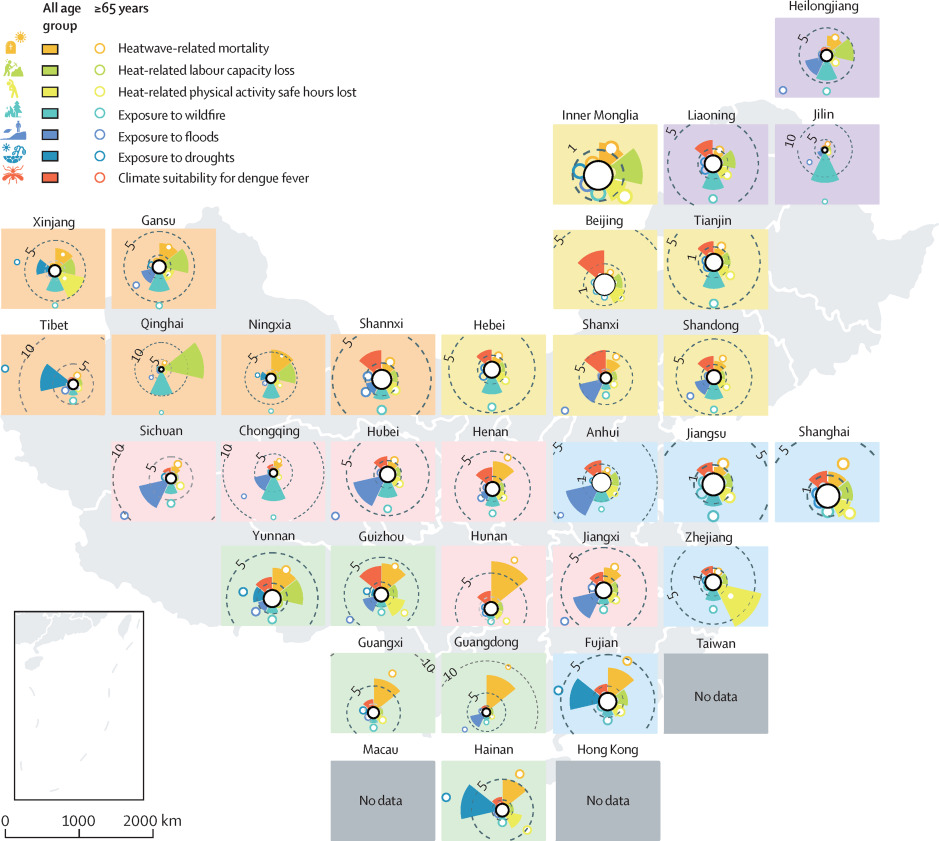
Figure 13. Health risks associated with climate change in each province in China in 2021 compared with historical baseline averages. The values of the conic bars and dots in each provincial figure represent the ratio of latest year values to historical baseline values. From Cai et al. (2022).
Di Napoli et al. (2022) present a summary and discussion of the indicators that have been identified by the Lancet Countdown. They point out that some indicators are positioned closer to the climate change hazard and some closer to the health impact – as to whether, and to what extent, climate change is affecting health, for better or for worse. To ensure that CCIEVIs are reproducible, relevant, and useful to scientific and policy-making communities, they identify the following five quality criteria that must be satisfied by health indicators which mirror the World Meteorological Organisation guidelines for climate indicators (Williams and Egglestone (2017)):
- Representativeness: a health indicator should track an aspect of both climate change and health, particularly focusing on the relationship between the two; it should do this across a timescale and geographical coverage sufficient for long-term global trends to be observed.
- Relevance: a health indicator should be clear and understandable to a broad range of audiences; global health indicator may also have value at local (i.e. national, regional) level for policy and decision makers.
- Robustness: a health indicator should use data and methods that are robust, reliable, and valid to track the relevant aspect of climate change and health; data from publicly available databases, and especially those developed by international organisations, governmental bodies, or academic institutions, are preferred; methods should be supported by a high standard of evidence from the scientific literature.
- Reproducibility: a health indicator should be calculated using an internationally agreed and published scientific method as well as open-access and quality-controlled data; the methodology underlying an indicator should be clearly laid out, including details of the process of data collection and processing, which must be done in a systematic and unbiased way; statistical analysis of the data should be carried out to support the interpretation of the data.
- Timeliness: a health indicator should be calculated regularly, with a short lag between the end of the period under consideration and the publication of the data; the calculation must be practicable with existing and future resources.
The Lancet Countdown presents 43 indicators that have been refined continuously along the years from 2015, and reflect the consensus of about 100 multidisciplinary researchers, the guidance of the Lancet Countdown's Scientific Advisory Group and High-Level Advisory Board, and the support of The Lancet and the Wellcome Trust. Some indicators have been revised recently to improve the monitoring of associations between climate change and health. For example, new and re-introduced metrics monitor the impact of extreme temperature on food insecurity; exposure to wildfire smoke; household air pollution; the alignment of the fossil fuel industry with a healthy future. All new or substantially modified indicators were assessed by an independent expert panel for appropriateness and robustness.
An example of indicator is:
Indicator 1.1.1: exposure to warming—headline finding: from 2000 to 2021, populations were exposed to an average increase in summer temperature two times higher than the global mean
Inhabited land areas warm up faster than oceans. By overlapping gridded temperature and population data, this indicator shows that the average temperatures humans were exposed to during summer seasons in 2021 were 0·6°C higher than the average in 1986–2005, representing twice the global mean temperature increase in the same period (0·3°C).
See the Lancet Countdown to get a graphical visualisation of the progress of people's exposure to heat. In this infographics recent trends in health determinants are presented.
To estimate indicators one needs to obtain prediction of future climate and particularly of the climatic variables that are most related to health determinants, that were already mentioned in Section 4. By adding more details, we may mention:
- Extreme rainfall determining urban and fluvial floods;
- Droughts (seasonal and long term) in terms of frequency, duration and water deficit (see Guo and Montanari (2023));
- Heat waves, in terms of maximum and minimum daily temperature, duration and extension;
- Wind storms, in terms of wind velocity, maximum gust, etc.
Another interesting example of health indicators - which essential refer to climate - is given by the essential climatic variables of the Global Climate Observing System (GCOS) (see Figure 14). Variables are grouped within 11 categories (see here for more details). The variables are further considered by the World Meteorological Organisation guidelines for climate indicators (Williams and Eggleston, 2017). The WMO climate indicators are quantitative properties that track the state or level of some aspect of the climate. One widely used indicator in climate science is the change in the global average temperature of the lower atmosphere. This indicator is also one of the targets set out by the 2015 Paris Agreement on climate change, which calls for keeping a global temperature rise this century to well below 2 °C above pre-industrial levels while pursuing efforts to limit the temperature increase even further, to 1.5 °C.
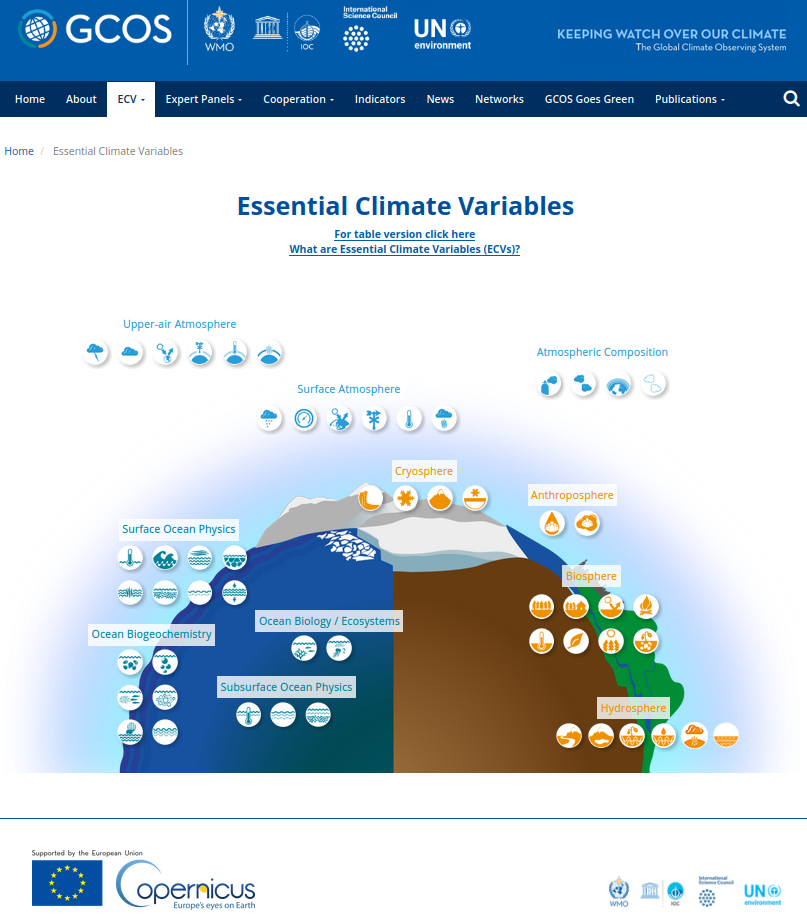
Figure 14. Essential climate variables considered by GCOS. Click here to see the figure with active links. By following the links on the figure indicators can be explored.
Another interesting reference is given by the Copernicus climate indicators. They are:
- Global temperature;
- European temperature;
- Arctic temperature;
- Carbon dioxide concentration;
- Carbon dioxide increase;
- Methane concentration;
- Ice loss in global glaciers;
- Ice loss in European glaciers;
- Ice loss in Greenland ice sheet;
- Global sea level increase;
- Global sea surface temperature;
- Loss of Arctic sea ice extent.
The US Environmental Protection Agency (EPA) suggests the indicators shown in Figure 15. Note the different meaning of the term "exposure" with respect to what we defined above. EPA uses the term "exposure" to mean the factors that expose people to climate change impact (hitherto we defined exposure as the value - not necessarily expressed in monetary terms - of the assets at risk, like people, industries, agricultural systems etc.).
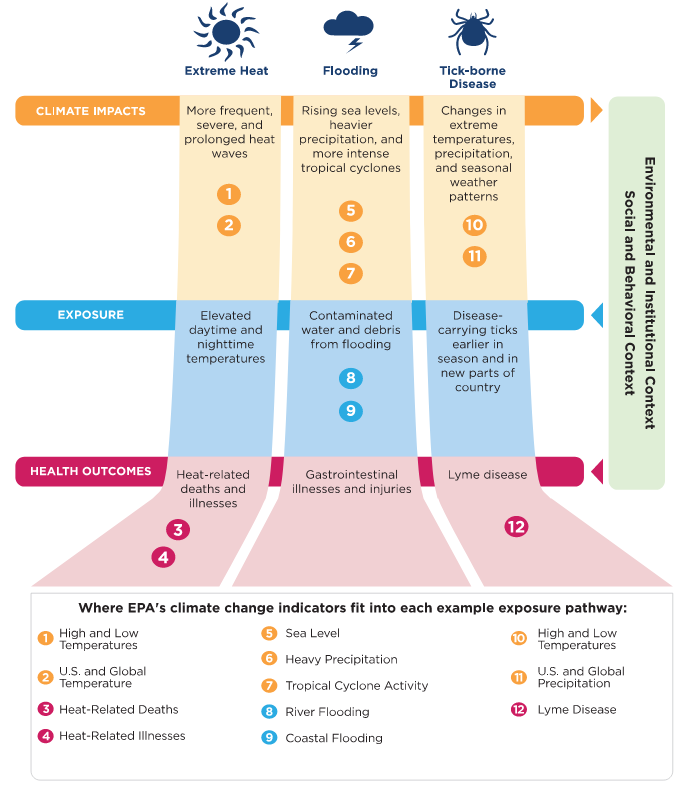
Figure 15. Indicators of impact of climate change on human health by the US Environmental Protection Agency (EPA).
It is important to consider that health indicators depend on the local context. For instance, if we refer to extreme rainfall as a determinant of floods, we need to consider that a relevant feature is the duration of the extreme rainfall. The most dangerous duration is that corresponding to the time taken to the flood to occur after the start of the rainfall event. So, for urban flooding, where the floods takes few minutes to occur after it starts raining, the most dangerous extreme rainfall is one with few minutes duration.
Therefore, health determinants and the relevant climatic variables should be determined with a refined analysis of the local conditions.
7. Identification of "health benefits" which may derive from climate change
Climate change is an alteration of the current climatic conditions, that may cause adverse effects but may also bring benefits. For example, farmers in some regions may benefit from the earlier onset of spring and from a longer warm season that is suitable for growing crops. Also, studies show that, up to a certain point, crops and other plants grow better in the presence of higher carbon dioxide levels and seem to be more drought-tolerant. In terms of human health, the lower frequency of cold waves may reduce the impact of flue and other communicable diseases.
In fact, historical reports confirm that cold periods are more challenging than warm periods for the socio-economic setting. Colder climate has been historically associated to an increased frequency of large scale floods, the uncontrolled expansion of wetlands and related waterborne infectious diseases.
An interesting example is given by The Medieval Warm Period (MWP), a time of warm climate from about 900 A.D. to 1300 A.D. During MWP global temperatures were apparently warmer than at present. The benefits were evident in Europe where grain crops flourished, alpine tree lines rose, many new cities arose, and the population more than doubled. The Vikings took advantage of the good climatic to colonize Greenland, and wine grapes were grown as far north as England where growing grapes is now not feasible, and about 500 km north of present vineyards in France and Germany. Grapes are presently grown in Germany up to elevations of about 560 m, but from about 1100 A.D. to 1300 A.D., vineyards extended up to 780 m. Wheat and oats were grown around Trondheim, Norway, suggesting climates about 1 °C warmer than present (Fagan, 2000).
Benefits from climate change are usually not reported and not investigated, as the concern for negative impacts dominates. It is also difficult to evaluate them, as they are mainly associated to socio-economic dynamics that may develop in the long term. On the contrary, damages due to climate change are more easily assessed.
The lack of consideration of the benefits due to climate change may potentially introduces a bias in the evaluation of the costs associated to adaptation and mitigation measures. As a matter of fact, when evaluating the cost of mitigation measures the additional costs related to the negative impacts of climate change mitigation are rarely considered.
8. Mitigating climate change impact on health
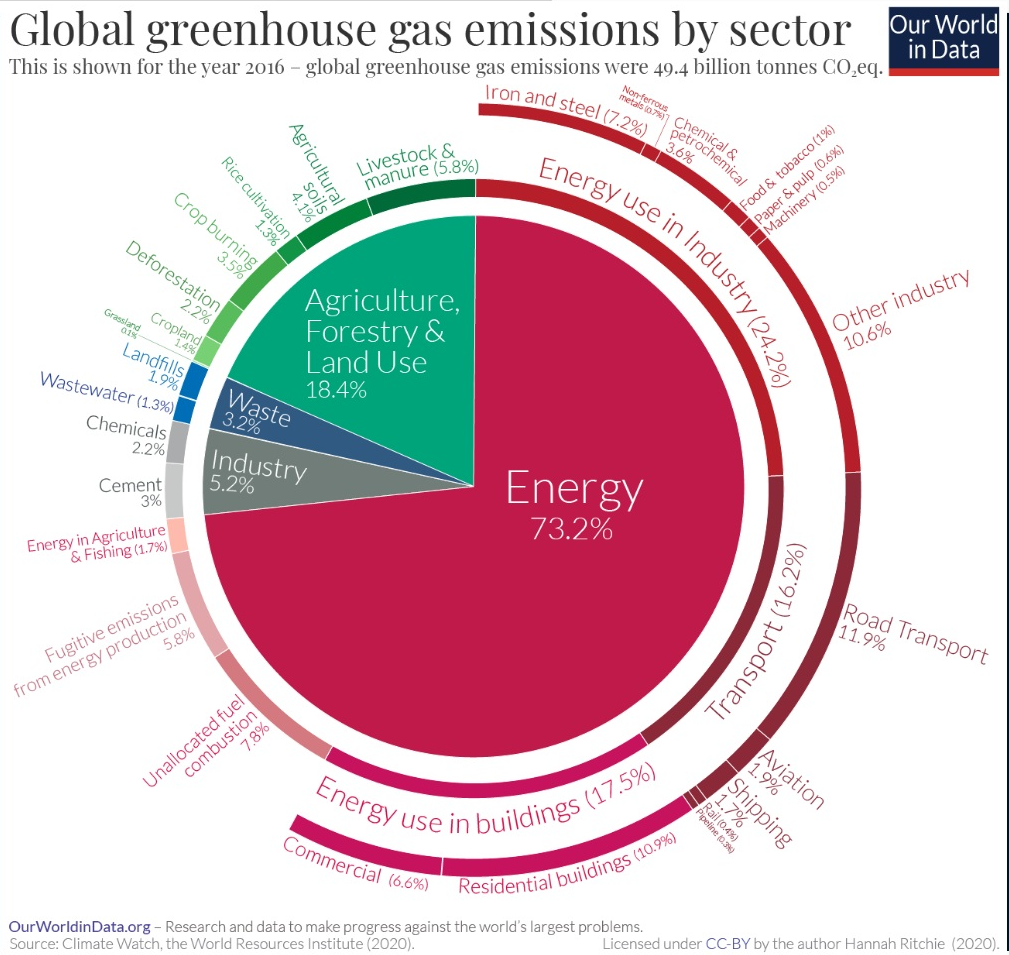
Figure 16. Greenhouse gases emissions by sector.
Figure 17 is an interactive chart from "Our world in data" which shows the progress of different contribution to emissions for different countries.
9. Critical synthesis
The above scientific results, evidence and considerations highlight that the evaluation of the impact of climate change on human health is a challenging task. Our conclusions can be summarized in the following items:
- Assessing the impact of climate change and human health requires the availability of predictions of future climate and socio-economic conditions. Beware of uncertainties. Integration of climate models with statistical analyses is essential in order to profit from any useful information. Prediction of socio-economic conditions is more difficult than prediction of climate. Beware that climate change is heterogeneous.
- Health determinants are essential to assess vulnerability and exposure of population and assets. Health determinants depend on the local conditions.
- Climate change is a very sensitive topic, with an ever evolving and extended literature. Climate change is still an open research question.
- Mitigation and adaptation are not alternatives. They need to be integrated to obtain a timely action. If resources are scarce, priorities should be assigned by carefully considering local conditions.
- In summary, the local context plays a relevant role. Beware of the geographical and socio-economic differences (see here for more details) and beware that equality, diversity and inclusivity are essential requirement for a successful mitigation and adaptation to climate change.
- Several actions for reducing the impact of climate change on human health are possible. To identify a good strategy, three main keywords may be considered: Understand, Monitor, Respond (see, for instance, a brief description here).
References
Beaglehole, R. and R. Bonita, 2008: Global public health: a scorecard. Lancet, 372(9654), 1988-1996.
Byass, P., 2010: The imperfect world of global health estimates. PLoS Medicine, 7(11), e1001006, doi:10.1371/journal.pmed.1001006.
Di Napoli, C., McGushin, A., Romanello, M., Ayeb-Karlsson, S., Cai, W., Chambers, J., ... & Robinson, E. J. (2022). Tracking the impacts of climate change on human health via indicators: lessons from the Lancet Countdown. BMC public health, 22(1), 1-8.
D.J. Dokken, K.J. Mach, M.D. Mastrandrea, T.E. Bilir, M. Chatterjee, K.L. Ebi, Y.O. Estrada, R.C. Genova,
B. Girma, E.S. Kissel, A.N. Levy, S. MacCracken, P.R. Mastrandrea, and L.L. White (eds.)]. Cambridge University
Press, Cambridge, United Kingdom and New York, NY, USA, pp. 709-754.
Fagan, Brian. 2000.The Little Ice Age.
Hughes, B.B., R. Kuhn, C.M. Peterson, D.S. Rothman, J.R. Solorzano, C.D. Mathers, and J.R. Dickson, 2011: Projections of global health outcomes from 2005 to 2060 using the International Futures integrated forecasting model. Bulletin of the World Health Organization, 89(7), 478-486
Luyten, A., Winkler, M. S., Ammann, P., & Dietler, D. (2022). Health impact studies of climate change adaptation and mitigation measures–A scoping review. The Journal of Climate Change and Health, 100186.
Mastrandrea, M.D., C.B. Field, T.F. Stocker, O. Edenhofer, K.L. Ebi, D.J. Frame, H. Held, E. Kriegler, K.J. Mach,
P.R. Matschoss, G.-K. Plattner, G.W. Yohe, and F.W. Zwiers, 2010: Guidance Note for Lead Authors of the IPCC Fifth
Assessment Report on Consistent Treatment of Uncertainties. Intergovernmental Panel on Climate Change (IPCC). Available at http://www.ipcc.ch
PAHO & WHO (2020). Climate change for health professionals, available at https://iris.paho.org/bitstream/handle/10665.2/52930/9789275122839_eng.pdf
Romanello M, McGushin A, Di Napoli C, Drummond P, Hughes N, Jamart L, et al. The 2021 report of the lancet countdown on health and climate change: code red for a healthy future. Lancet N Am Ed 2021;398:1619–62. doi: 10.1016/S0140-6736(21)01787-6.
Saulnier, D., Dixit, A. M., Nunes, A. R., & Murray, V. (2020). Disaster Risk Factors–Hazards, exposure, and vulnerability. In WHO Guidance on Research Methods for Health Emergency and Disaster Risk Management (pp. 151-163). World Health Organization.
Smith, K.R., A. Woodward, D. Campbell-Lendrum, D.D. Chadee, Y. Honda, Q. Liu, J.M. Olwoch, B. Revich, and
R. Sauerborn, 2014: Human health: impacts, adaptation, and co-benefits. In: Climate Change 2014: Impacts,
Adaptation, and Vulnerability. Part A: Global and Sectoral Aspects. Contribution of Working Group II to the
Fifth Assessment Report of the Intergovernmental Panel on Climate Change [Field, C.B., V.R. Barros,
D.J. Dokken, K.J. Mach, M.D. Mastrandrea, T.E. Bilir, M. Chatterjee, K.L. Ebi, Y.O. Estrada, R.C. Genova,
B. Girma, E.S. Kissel, A.N. Levy, S. MacCracken, P.R. Mastrandrea, and L.L. White (eds.)]. Cambridge University
Press, Cambridge, United Kingdom and New York, NY, USA, pp. 709-754.
Wang, H., L. Dwyer-Lindgren, K.T. Lofgren, J.K. Rajaratnam, J.R. Marcus, A. Levin- Rector, C.E. Levitz, A. Lopez, and C.J.L. Murray, 2012: Age-specific and sex-specific mortality in 187 countries, 1970-2010: a systematic analysis for the Global Burden of Disease Study 2010. Lancet, 380, 2071-2094.
WHO, 2008: The Global Burden of Disease. 2004 Update. World Health Organization (WHO), Geneva, Switzerland, 146 ppe.
Williams M, Eggleston S. Using indicators to explain our changing climate to policymakers and the public. World Meteorological Organisation Bulletin. 2017;66(2).
Download the powerpoint presentation of this lecture.
Last modified on November 14, 2023
- 167 views